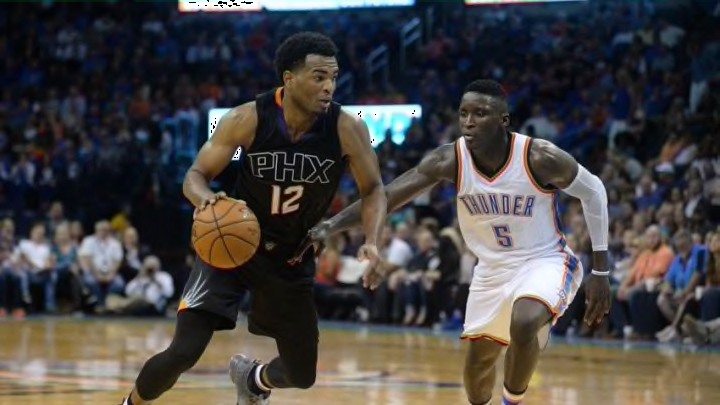
TJ Warren is off to a great start in his third season with the Suns, begging the question is he making the leap?
With Eric Bledsoe and Devin Booker the Suns have two budding stars, but as is the trend in the league now Big 3s are all the rage. Is TJ Warren making the proverbial ‘leap’ to form a big three with Bledsoe and Booker? With his rookie contract almost up, and salary cap numbers jumping up, an explosion of production can be lucrative for Warren and a great sign for the future of the Suns as a team. The details behind Warren’s mainly offensive explosion are interesting and provide insight into whether these numbers will be the norm going forward or are just part of a hot streak that will cool.
The Leap
TJ Warren has seen his minutes increase and is a starter for the first time in his career this season and has seen his numbers increase because of it. Warren’s minutes, field goals attempted, free throws attempted, assists, steals, rebounds, and points have all increased on a per game basis. Also, the Suns’ offensive rating has been 4.3 points better with Warren on the floor this year (source: NBA.com/stats)

The table above shows Warren’s per game numbers and how they have changed season by season so far. The increases are all relatively normal given the huge jump in minutes (approximately 15 more minutes per game), however, the drop in FG% and 3P% could be worrisome in Warren’s development. The silver lining is that isn’t likely the permanent case (more on this later). Credit the table both above and below to basketball-reference.com.

Warren’s advanced numbers show that the increase in minutes isn’t the root cause of better numbers. His advanced numbers based on efficiency have all improved. These included Win Shares per 48 (.117 from .101), VORP (.3 from .2), Box Score Plus Minus (.6 from -1.2), and PER (18.3 from 15.7). All those stats are numbers from basketball-reference.com which are explained in detail on the basketball-reference.com glossary page. The short explanation is that they are all rate based numbers which are prorated based on minutes, possessions and games. Thus an improvement in all these would not be based solely on an increase in minutes.
Also, the decline in Warren’s shooting numbers could be a result of the increase in Warren’s usage rating from 19.9% last year to a heavy burden at 23.2% this so far this year. However decreases in Warren’s BLK%, AST% and DRB% are worrisome as those could be indicative or some regression. They are offset by a decrease in Warren’s TOV% and an increase in Warren’s STL%. Those numbers are also rates based on Warren’s minutes and wouldn’t change solely because of minutes changes.
| Season | DRE | DRE per Min |
| 2014-15 | -10.64 | 0.119 |
| 2015-16 | 28.24 | 0.162 |
| 2016-17 | 24.19 | 0.198 |
This last table shows Warren’s DRE and DRE per min over his 3 seasons. His DRE so far this year is slightly lower than last, which mainly could be a result of his depressed shooting numbers. His DRE, when calculated with shooting numbers from last year, would increase to 36.192, which would be in line with the leap we have seen in many of his other numbers.
Overall, Warren’s improved numbers seem to indicate improved play that will hold on throughout the season and continue to improve as his career goes on. The one category of stats that does not display that so far are Warren’s shooting numbers, I look to explain how those in the next section.
Follow Valley of the Suns on Twitter at @ValleyOfTheSuns and on Facebook at Facebook.com/PhoenixSunsBlog.
